

◊ By Sudha Narasimhachar
Note: To find organic product suppliers in India, buy the Organic Directory
Earlier this year, the European Commission released its agricultural market brief, Organic imports in the EU – A First Analysis – Year 2018. This report shares data published in the same. The analysis is based on the EU’s organic food imports of 2018. All food products mentioned are to be understood as being organic notwithstanding prefixation of the word ‘organic’.
The European Union imports organic food products from around the world and since October 2017, the Certificate of Inspection (CoI) that must accompany every consignment entering the EU, has become electronic. This has made it easy to trace the country of origin of the consignments and also create a database on the imports of organic products. Besides volume-based categorisation, the data is also provided on product-wise basis.
At present, the EU imports organic agrifoods from 115 third countries under two categories:
- Equivalent third countries (US, Canada, Japan, South Korea, India, Argentina, Australia, New Zealand, Costa Rica, Chile, Israel, Switzerland and Tunisia), which have a production and control system recognised as equivalent, for certain product categories, by the EU.
- The Control Body System—private bodies authorised by the European Commission—that are listed under the same Regulation (as equivalent third countries). They can operate in third countries and certify operators for the purpose of exports. However, from 2021, when the new Regulation 2018/848 comes into effect, the control bodies will have to comply with EU rules.
TRACES & E-COI
TRACES (Trade Control and Expert System) is the European Commission’s digital management tool hosting the sanitary certificates requested on intra-EU trade and importation of animals, food, feed and plants. It is available in 35 languages, 24 hours a day, 7 days a week, and is free of charge. Its main objective is to simplify and accelerate the trading process by centralising all data inserted in those certificates. The module for COIs has been developed according to the Organic regulation in force. It ensures the traceability of the products to be imported into the EU as organic, as well as, the exchange of information between the different actors of the supply chain. The system provides an automatic built-in check for the CN codes of the products, by allowing only the import of products falling in the scope of the EU organic legislation.
IMPORT OF ORGANIC AGRIFOOD PRODUCTS INTO EU IN 2018
In 2018, the EU imported a total of 3.3 million tonne of organic agrifood produce. A monthly sheet is published by DG AGRI (The Commission’s Directorate-General for Agriculture and Rural Development), called Monitoring Agri-trade Policy, in order to monitor EU trade of organic agrifood products. According to this publication, the products are divided into 6 classes as given below:
- Commodities: Cereals, Vegetable Oils & Oilseeds, Sugars, Milk Powders, Butter, Unroasted Coffee & Cocoa, etc.
- Other Primary Products: Meat Products, Fruits, Vegetables, Milk, Yogurt, Honey.
- Processed: Cheese, Meat Preparations, Wine, Fruit Juices.
- Food Preparations: Infant Food, Confectionery, Pasta.
- Beverages: Beers, Spirits, Soft Drinks.
- Non-edible Products: Plants, Essential Oils.
Commodities contribute 57.1% to the total organic agrifood imported by the EU; Other Primary Products contribute 35.1%; and processed products, including wine make up 6%. Food preparations and non-edible products contribute 1% and 0.5% respectively. Non agri products constitute just 0.2% of total organic imports.
The organic regulation also covers products of the fishery sector, which are reported under the non-agri label.
In terms of volume, China is the largest supplier of organic agrifoods to the EU, making up 12.7% of the total organic agrifood imports. Ecuador, Dominican Republic, Ukraine and Turkey contribute roughly 8% to EU imports, while India accounts for 3.9% of the total EU imports of organic foods.
VOLUME OF ORGANIC AGRIFOOD IMPORTS INTO THE EU PER COUNTRY:
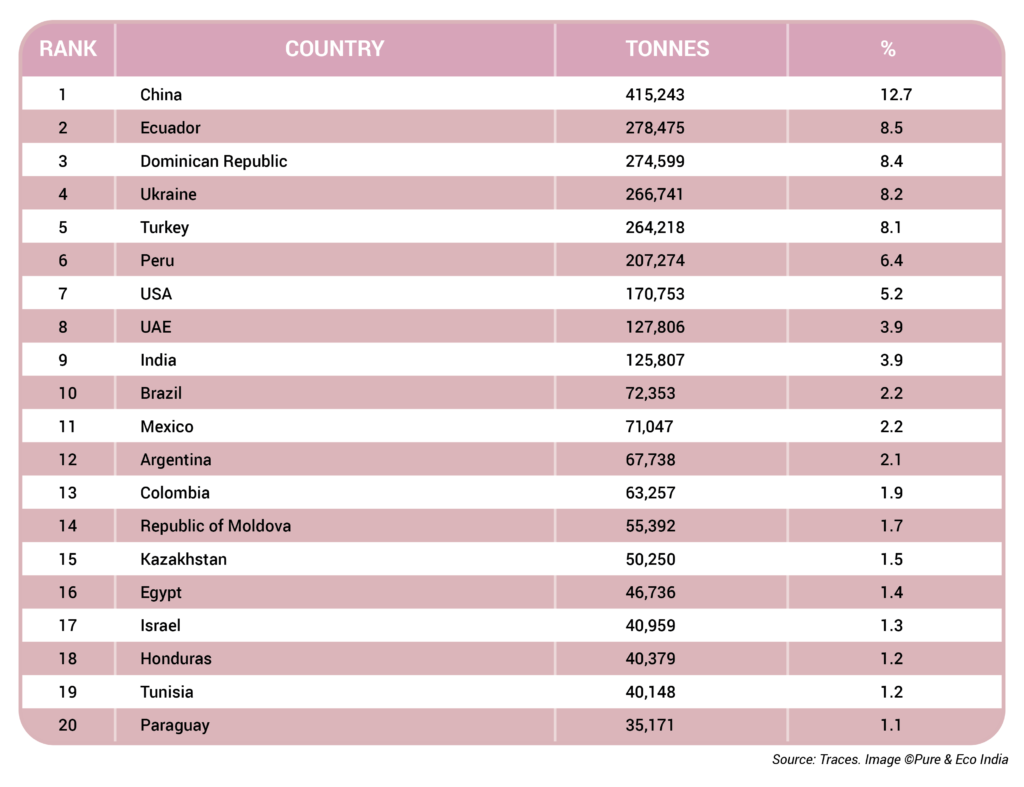
TOP 10 COUNTRIES EXPORTING ORGANIC AGRIFOODS TO EU (VOLUME-WISE)
1] China: China is the top exporter of organic products to the EU in volume, exporting organic food products to the tune of 415,243 tonne in 2018.
Oilcake is its most major organic export product, contributing 74.8% (310,535 tonne) to its total organic agrifood export to the EU. Of this, 23,479 tonne is attributed to soybeans; 20,864 tonne consists of oilseeds other than soybeans; 11,371 tonne is tropical fruit (fresh or dried), nuts and spices; 10,671 tonne is vegetables (fresh, chilled and dried); 9,418 tonne is flour and other products of the milling industry; and 5,778 tonne is fruit juices. China only exports 4,093 tonne of eggs and honey; and 4,030 tonne of unroasted coffee, tea in bulk and maté.
2] Ecuador: Ecuador is the 2nd largest exporter of organic foods to the EU in terms of volumes, with annual exports of 278,475 tonne, representing 8.5% of the total organic food imports of the EU. Out of the 278,475 tonne it exports, 90.5% or 252,015 tonne is tropical fruit (fresh or dried), nuts and spices; 10,473 tonne is preparations of vegetables, fruits or nuts; and 6,656 tonne is palm & palm kernel oils.
Ecuador only exports 2,446 tonne of fish; 1,982 tonne of cocoa beans; 1,856 tonne of vegetables (fresh, chilled, dried); 1,462 tonne of beet & cane sugar; 406 tonne of unroasted coffee, tea in bulk and maté; and 364 tonne of cereals (other than wheat and rice).
3] Dominican Republic: Dominican Republic supplies the EU almost exclusively with tropical products. It exports 274,599 tonne of organic food to the EU. Of this, 89.7% or 246,341 tonne is tropical fruit (fresh or dried), nuts and spices; 27,062 tonne is cocoa beans; and 886 tonne is citrus fruit.
4] Ukraine: Ukraine supplies 266,741 tonne of organic food to the EU in a year. Of this, 114,201 tonne is cereals, other than wheat and rice; 75,971 tonne is wheat; 28,773 tonne is oilseeds, other than soybeans; 13,269 tonne is soybeans; and 12,955 is tonne is fruit, fresh or dried, excluding citrus and tropical fruit.
Ukraine only exports 5,947 tonne of fruit juices; 3,922 tonne of flours and other products of the milling industry; 3,552 tonne of vegetables (fresh, chilled and dried); and 2,564 tonne of oilcakes.
5] Turkey: In 2018, Turkey exported a total of 264,218 tonne of organic food to the EU. Of this, wheat made up 52,090 tonne; cereals other than wheat and rice made up 47,012 tonne; oilseeds other than soybeans made up 44,761 tonne; 34,186 tonne was vegetables (fresh, dried or chilled); 30,401 tonne was fruit, fresh or dried, excluding citrus and tropical fruit; 22,969 tonne was fruit juices; and 11,494 tonne was tropical fruit, fresh or dried, nuts and spices.
Turkey only exports 6,100 tonne of organic soybeans; and 4,870 tonne of preparations of vegetables, fruit or nuts.
6] Peru: Peru exports a total of 207,274 tonne of organic food to the EU. Of this, 66.2% or 137,235 tonne is tropical fruit, fresh or dried, nuts and spices; 39,860 tonne is unroasted coffee, tea in bulk and maté; and 15,558 tonne is cocoa beans.
Peru also exports 5,336 tonne of organic cereals other than wheat and rice; 2,418 tonne of beet & cane sugar; 1,896 tonne of fruit, fresh or dried, excluding citrus and tropical fruit; 1,331 tonne of cocoa paste and powder; 1,019 tonne preparations of vegetables, fruit or nuts; and 988 tonne of flours and other products of the milling industry.
7] USA: USA exports a total of 170,753 tonne of organic food to the EU in a year. Of this 86.6% or 147,924 tonne is rice. In contrast, India—which is a prolific grower of rice—only exports 19,332 tonne of organic rice to the EU.
The USA also exports 3,994 of fruit, fresh or dried, excluding citrus and tropical fruit; 3,954 tonne of vegetables (fresh, dried or chilled); 2,997 tonne of soups and sauces; 2,932 tonne of fruit juices; 2924 tonne of wine, vermouth, cider and vinegar; 1,475 tonne of tropical fruit, fresh or dried, nuts and spices; 810 tonne of vegetable oils other than palm and olive oils; and 696 tonne of sugar, other than beet and cane.
8] United Arab Emirates: The UAE exports a total of 127,806 tonne of organic food to the EU. Of this, 43,648 tonne is wheat; 39,282 tonne is oilseeds other than soybeans; and 36,578 tonne is cereals other than wheat and rice.
The UAE also exports 5,223 tonne of organic vegetables (fresh, dried or chilled); 3,000 tonne of oilcakes; and 74 tonne of tropical fruit, fresh or dried, nuts and spices.
The UAE works as a hub of distribution to the EU owing to its location.
9] India: India exports a total of 125,807 tonne of organic food to the EU. Of this, 22,794 tonne is beet and cane sugar; 20,464 tonne is soybeans; 19,332 tonne is rice; 17,260 tonne is oilcakes; 13,892 tonne is oilseeds other than soybeans; and 7,995 tonne is preparations of vegetables, fruit or nuts.
India also exports 6,433 tonne of unroasted coffee, tea in bulk and maté; 3,798 tonne of tropical fruit, fresh or dried, nuts and spices; and 3,088 tonne of flours and other products of the milling industry.
10] Brazil: Brazil is 10th in the ranking of key exporters to the EU, with a total of 72,353 tonne of organic food exports. Of this 73.6% or 53,244 tonne is organic beet & cane sugar.
It also exports 4,267 tonne of eggs and honey; 4,234 tonne of oilcakes; 2,727 tonne of fruit juices; 1,234 tonne of unroasted coffee, tea in bulk and maté; 1,183 tonne of palm and palm kernel oils; 955 tonne of fruit, fresh or dried, excluding citrus and tropical fruit; 866 tonne of tropical fruit, fresh or dried, nuts and spices; and 791 tonne of soybeans.
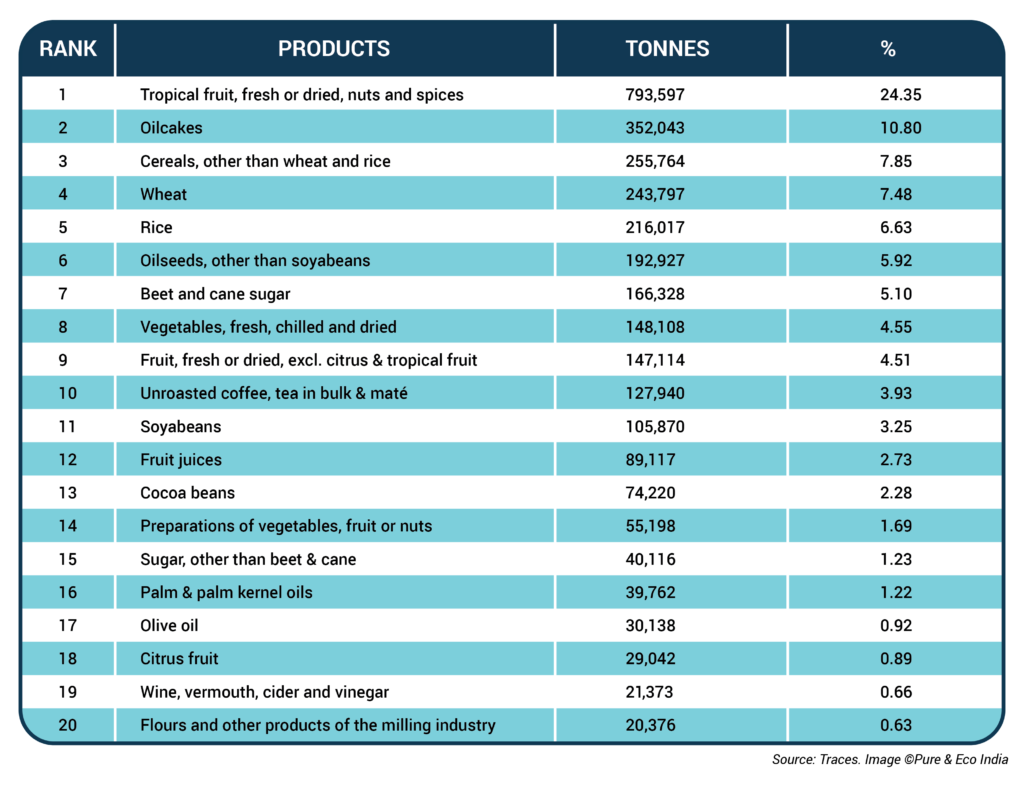
VOLUME OF ORGANIC AGRIFOOD IMPORTS INTO THE EU PER PRODUCT CATEGORY:
TOP 10 COUNTRIES EXPORTING ORGANIC AGRIFOODS TO EU (VALUE-WISE)
When the value of imports is taken as a reference point, Peru and China are at the top, enjoying 7.8% each of the total organic agriproduct imports of the EU, followed by Turkey and Dominican Republic at 6.8% each. Ecuador has acquired 6.5% of EU organic agrifood imports, followed by USA, at 5.6%; Mexico and Tunisia at 4.3% and 4.1% respectively; whereas India is at 9th position, contributing 3.8% to the same. The remaining 46.6% of organic agrifoods imported by the EU belong to other nations collectively.
VOLUME OF INDIAN ORGANIC AGRIFOOD EXPORT TO EU:
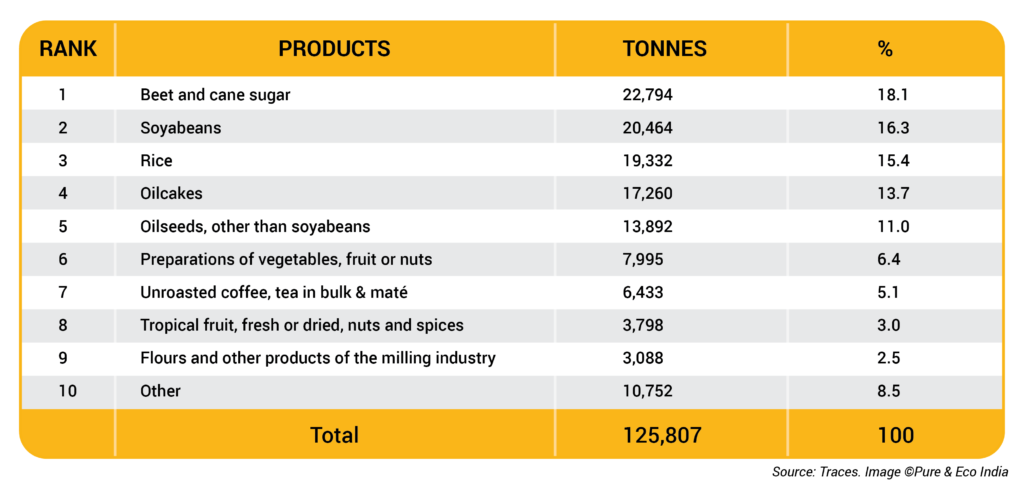
TOP 10 ORGANIC AGRIFOODS EXPORTED TO EU (VOLUME-WISE)
1] Tropical Fruit (Fresh or Dried), Nuts and Spices: The organic agriproduct to be exported most prolifically to the EU is tropical fruit (fresh or dried), nuts and spices, to the tune of 793,597 tonne (27.2% of the total amount of organic agrifood imports of EU).
It is mainly sourced from Ecuador (252,015 tonne)—followed by the Dominican Republic (246,341 tonne) and Peru (137,235 tonne). Columbia exports 18,952 tonne of this product; Mexico exports 12,835 tonne; Côte d’Ivoire 12,686 tonne; Ghana 11,527 tonne; Turkey 11,494 tonne; and China exports 11,371 tonne.
India does not feature in the top 10 countries that export this product, with a mere 3,798-tonne export volume under the category.
2] Oilcakes: The EU imports 352,043 tonne of organic oilcakes—mainly from China (310,535 tonne or 74.8% of the total amount of oilcakes imported into the EU). Ukraine exports 2,564 tonne of oilcakes to the EU; the UAE 3,000 tonne; India 17,260 tonne; and Brazil 4,234 tonne.
3] Cereals, other than Wheat and Rice: The EU imports 255,764 tonne of organic cereals, other than wheat and rice—chiefly from Ukraine, to the tune of 114,201 tonne, constituting 42.8% of its entire EU organic agrifood basket. It is Ukraine’s top exported product. Also, 47,012 tonne is exported from Turkey; 36,578 tonne from the UAE; 5,336 tonne from Peru; and 364 tonne from Ecuador.
India did not export under this product category in 2018.
4] Wheat: The EU imports 243,797 tonne of wheat—75,971 tonne from Ukraine; 52,090 tonne from Turkey; and 43,648 tonne from the UAE.
India did not export under this product category in 2018.
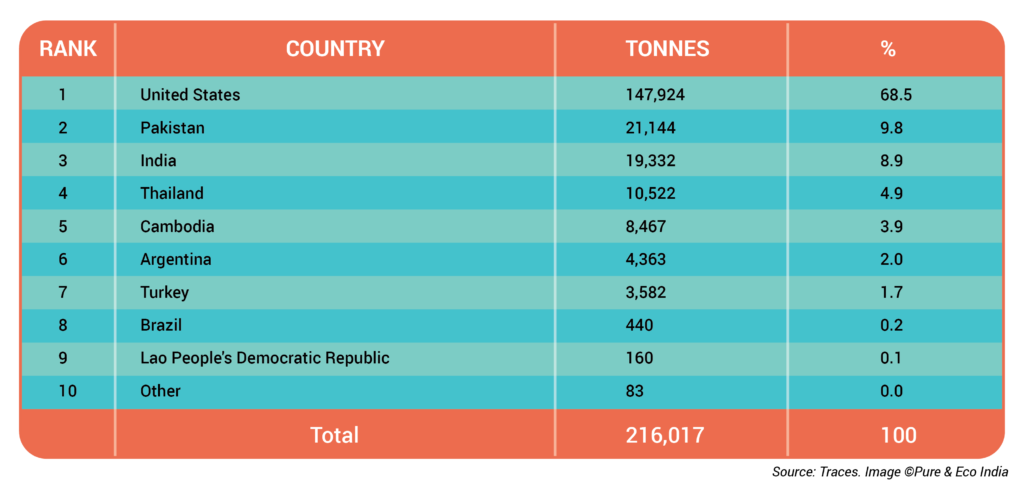
5] Rice: The EU imports 216,017 tonne of organic rice—chiefly from the United States—which exported organic rice to the tune of 147,924 tonne to the EU in 2018. This makes up 68.5% of the total organic rice imported by the EU in the same year.
Pakistan exported 21,144 tonne of organic rice; India 19,332 tonne; Thailand 10,522 tonne; Cambodia 8,467 tonne; Argentina 4,363 tonne; Turkey 3,582 tonne; Brazil 440 tonne; and Laos 160 tonne.
6] Oilseeds other than Soybeans: In 2018, the EU imported 192,927 tonne of organic oilseeds (excluding soybeans)—20,864 tonne from China; 28,773 tonne from Ukraine; 44,761 tonne from Turkey; 13,892 tonne from India; and 1,680 tonne from Mexico.
7] Beet & Cane Sugar: In 2018, the EU imported 166,328 tonne of organic beet & cane sugar—chiefly from Brazil—to the tune of 53,244 tonne, 73.6% of the country’s total organic agrifood export to the EU.
Although beet & cane sugar is also India’s most exported organic agrifood to the EU, the volume is more modest, at 22,794 tonne.
Ecuador, Peru and Tunisia also export to the EU under this product category, having exported 1,462 tonne, 2,418 tonne and 557 tonne respectively in 2018.
8] Vegetables (Fresh, Chilled and Dried): In 2018, the EU imported 148,108 tonne of organic vegetables (fresh, chilled and dried) — 10,671 tonne from China; 1,856 tonne from Ecuador; 3,552 from Ukraine; 34,186 tonne from Turkey; 3,954 tonne from USA; 5,223 tonne from UAE; and 120 tonne from Tunisia.
India did not export under this product category in 2018.
9] Fruit, Fresh or Dried (excluding Citrus & Tropical Fruit): In 2018, the EU imported 147,114 tonne of organic fruit (fresh or dried, excluding citrus and tropical fruit). Under this category, Argentina and Turkey are the top two exporters, contributing 30,522 tonne and 30,401 tonne respectively. New Zealand ranks 3rd, with 16,845 tonne of export share. Chile exports 14,616 tonne; Serbia 13,199 tonne; Ukraine 12,955 tonne; Morocco 5,147 tonne; USA 3,994 tonne and South Africa 3,840 tonne.
India did not export under this product category in 2018.
10] Unroasted Coffee, Tea in Bulk & Maté: In 2018, the EU imported 127,940 tonne of organic unroasted coffee, tea in bulk & maté. Under this category, Peru is the highest supplier in volume at 39,860 tonne of export; followed by Honduras (39,496 tonne) and Mexico (9,154 tonne). India exported 6,433 tonne; Ethiopia 5,225 tonne; Uganda 4,926 tonne; China 4,030 tonne; Columbia 3,338 tonne and Nicaragua 2,605 tonne.
This wraps up the top 10 organic agrifoods exported to the EU, in terms of volume. However, there are other voluminous exports to the EU also, such as Soybeans (total 105,870 tonne; China 23,479 tonne; India 20,464 tonne); Fruit Juices (total 89,117 tonne; Turkey 22,969 tonne); Cocoa Beans (total 74,220 tonne; Dominican Republic 27,062 tonne); Preparations of Vegetables, Fruits or Nuts (total 55,198 tonne; Dominican Republic 27,062 tonne; Ecuador 10,473 tonne); etc.
Organic palm, palm kernel oils, wine, flours, eggs, honey, instant foods, olive oil, vegetable oils, pasta, and many other products are exported to the EU as well, but in smaller numbers.
ORIGIN OF ORGANIC RICE PER COUNTRY OF ORIGIN:
HIGHER SIGNIFICANCE OF CERTAIN ORGANIC PRODUCTS
In order to assess the importance of organic agrifood imports out of the total agrifoods (organic and conventional) imported into the EU, an analysis was made of the share of organic produce on the total, in terms of product categories.
As per this analysis, the top 10 organic agrifood product categories are (1 to 10): Olive Oil, Flours and other Milling Industry Products, Beet & Cane Sugar, Rice, Tropical Fruit, Seeds & Hop Cones, Eggs & Honey, Fruit Juices, Cocoa Beans and Wheat.
Olive oil represents the most important product category, with 20.7% of the total imported olive oil being organic. Flours and other products of the milling industry have a share of 15.2%; beet & cane sugar enjoy 11% organic share; and rice has 10.9 %. Only 9% of the total tropical fruit, fresh or dried, nuts and spices imported into the EU is organic.
Therefore, it is evident that there is more demand for specific organic products, such as organic olive oil, flours, sugar, rice and tropical fruits.
INDIA’S KEY COMPETITORS IN ORGANIC AGRIFOOD EXPORT TO EU:
Rice: USA, Pakistan
Flours & other Products of the Milling Industry: China, Ukraine
Soybeans: China
Beet & Cane Sugar: Brazil
Unroasted Coffee, Tea in Bulk & Maté: Peru, Mexico
Oilseeds (other than Soybeans): Turkey, UAE, Ukraine, China
Preparations of Vegetables, Fruit or Nuts: Ecuador
Tropical Fruit (Fresh or Dried), Nuts & Spices: Ecuador, Dominican Republic, Peru, Mexico, Turkey, China, Tunisia
Oilcakes: China
INDIA’S COMPETITORS IN ORGANIC AGRIFOOD DOMAIN
Despite being home to the largest number of organic farmers in the world (835,000) India has only a modest share in the EU organic agrifoods pie, contributing merely 3.9% to the total organic agrifoods imported by the EU in 2018.
Its key competitors (volume-wise) are amongst the Top 10 Exporters of Organic Agrifood to the EU, with China at the helm, followed by Ecuador, Dominican Republic, Ukraine, Turkey, Peru, USA and the UAE. This could be due to *China’s larger certified organic land share, at 3.02 million hectares, as opposed to India’s 1.78 million hectares (third party, excluding PGS). These figures include in-conversion land. It must be noted that the 3.02 ha million only includes organic land as per Chinese standards. China has another 1.3 million ha of certified organic land as per international standards, which is not included in the 3.02 ha million figure.
Value-wise, India’s key competitors are Peru, China, Turkey, Dominican Republic, Ecuador, USA, Mexico, and Tunisia.
Now, let us take a look at India’s key competitors in its top 9 most exported (to the EU) organic food categories:
1] Beet & Cane Sugar: In this product category, Brazil is India’s key competitor. In 2018, the former exported 53,244 tonne of organic beet & cane sugar to the EU, whereas India only exported 22,794 tonne of the same. This, when beet & cane sugar is India’s most exported organic food to the EU.
2] Soybeans: In this product category, China is India’s key competitor. In 2018, the former exported 23,479 tonne of organic soybeans to the EU, whereas India exported 20,464 tonne of the same.
3] Rice: In this product category, USA is the key exporter. In 2018, the former exported 147,924 tonne of organic rice to the EU, whereas India only exported 19,332 tonne of the same. *Pakistan, which has only 51,304 hectares under organic cultivation, with only 25 organic producers, exported more organic rice than India, at 21,144 tonne in the same year.
4] Oilcakes: In this product category, China is the key exporter. In 2018, the former exported 310,535 tonne of organic oilcakes to the EU, whereas India only exported 17,260 tonne of the same.
5] Oilseeds, other than Soybeans: In this product category, Turkey and the UAE are the key exporters, exporting 44,761 tonne and 39,282 tonne of organic oilseeds, other than soybeans in 2018. Ukraine and China are also prolific exporters of this product, with export volumes of 28,773 tonne and 20,864 tonne respectively in 2018. India only exported 13,892 tonne of the same in the same year.
6] Preparations of Vegetables, Fruit or Nuts: In this product category, Ecuador is India’s key competitor. In 2018, the former exported 10,473 tonne of preparations of organic vegetables, fruit or nuts to the EU, whereas India only exported 7,995 tonne of the same in the same year.
7] Unroasted Coffee, Tea in Bulk & Maté: In this product category, Peru is the key exporter. In 2018, it exported 39,860 tonne of organic unroasted coffee, tea in bulk & maté to the EU. Mexico exported 9,154 tonne of the same, whereas India exported 6,433 tonne in the same year.
8] Tropical Fruit (Fresh or Dried) Nuts and Spices: In this product category, Ecuador, the Dominican Republic and Peru are the key exporters, exporting 252,015 tonne, 246,341 tonne and 137,235 tonne respectively in 2018.
In the same year, Mexico, Turkey and China exported 12,835 tonne, 11,494 tonne and 11,371 tonne of the same. India fared poorly in this regard, with a mere 3,798 tonne exported under this category, with even Tunisia faring better with export volume of 6,861 tonne.
9] Flours and Other Products of the Milling Industry: In this product category, China is the key exporter. In 2018, it exported 9,418 tonne of organic flours and other products of the milling industry to the EU. Ukraine exported 3,922 tonne of the same, whereas India exported 3,088 tonne in the same year.
CHINA IS THE TOP EXPORTER
The top exporter of organic foods to the EU is China, both in terms of volumes and value. It has more land under organic cultivation than India, at 3.02 million hectares (plus 1.3 million ha organic certified as per international standards), as opposed to India’s 1.78 million hectares (including in-conversion area).
Whereas India has just 1% of its total agricultural land under organic cultivation, China has only 0.6% under organic—and it is converting into organic faster than India. As per the fiBL Survey 2019, China increased organic land from 2017 to 2019 by 741,785 hectares as opposed to India, which increased organic certified land by 290,000 hectares within the same duration.
**In 2018, China issued 12,285 certificates for organic farms; 5,245 certificates for organic processors; 924 certificates for organic animal farms; 515 certificates for aquaculture farms; and 416 certificates for wild collections.
China has only *12,285 organic producers as opposed to the 835,000 in India. But it has more exporters, at 1,198, whereas India has only 669 exporters (as of 2016) of organic products.
**In 2018, China exported organic products to approximately 30 countries, amounting to 0.7051 million tonne and sales value of USD 894 million (0.5249 million tonne of primary products with sales value of USD 504 million, and 0.1801 million tonne of processed products with sales value of USD 390 million). No organic animal products were exported by China in 2018. Organic products were mostly exported to the UK, Germany, Holland, Italy, France, Sweden, Denmark and Spain, followed by Canada and USA, as well as Australia, New Zealand and Asian countries such as Japan, Korea, Singapore and Thailand. Small quantities of organic products were also exported to Africa and South America.
China is one of the largest producers of organic cereals in the world, at 905,000 hectares under organic cereal cultivation. It also has 330,000 hectares under organic dry pulses cultivation; 22,400 hectares under temperate fruit cultivation; 24,500 hectares under organic grape cultivation; and 279,300 hectares under organic vegetables cultivation.
China also has 167,000 hectares under organic oilseeds cultivation, whereas India has 130,000 hectares under organic for the same.
Source: The World of Organic Agriculture – Statistics & Emerging Trends 2019
*There is no official data available on farmers involved in organic farming in China. The FIBL/IFOAM data only counts the number of certified organic farms as the number of Chinese organic farmers. There are many more farmers involved in organic farming in China. Most Chinese organic farms are leased to companies (the owners of the farmlands have leased out their farmlands to companies and then work for the latter as farm workers). If farmers working for farms certified as per foreign organic standards for exporting, farmers involved in CSA organic farming and also those engaged in organic animal husbandry, organic aquaculture and organic wild collection, are counted, there should be about 200,000 organic farmers in China. – Input by Zhou Zejiang, President of IFOAM Asia; Ambassador of IFOAM Organics International; Senior Advisor of the Organic Food Development Center – Ministry of Ecology and Environment; Research Professor at Nanjing Institute of Environmental Sciences
**Input by Zhou Zejiang, President of IFOAM Asia; Ambassador of IFOAM Organics International; Senior Advisor of the Organic Food Development Center – Ministry of Ecology and Environment; Research Professor at Nanjing Institute of Environmental Sciences
*Source: The World of Organic Agriculture – Statistics & Emerging Trends 2019
highly interested